

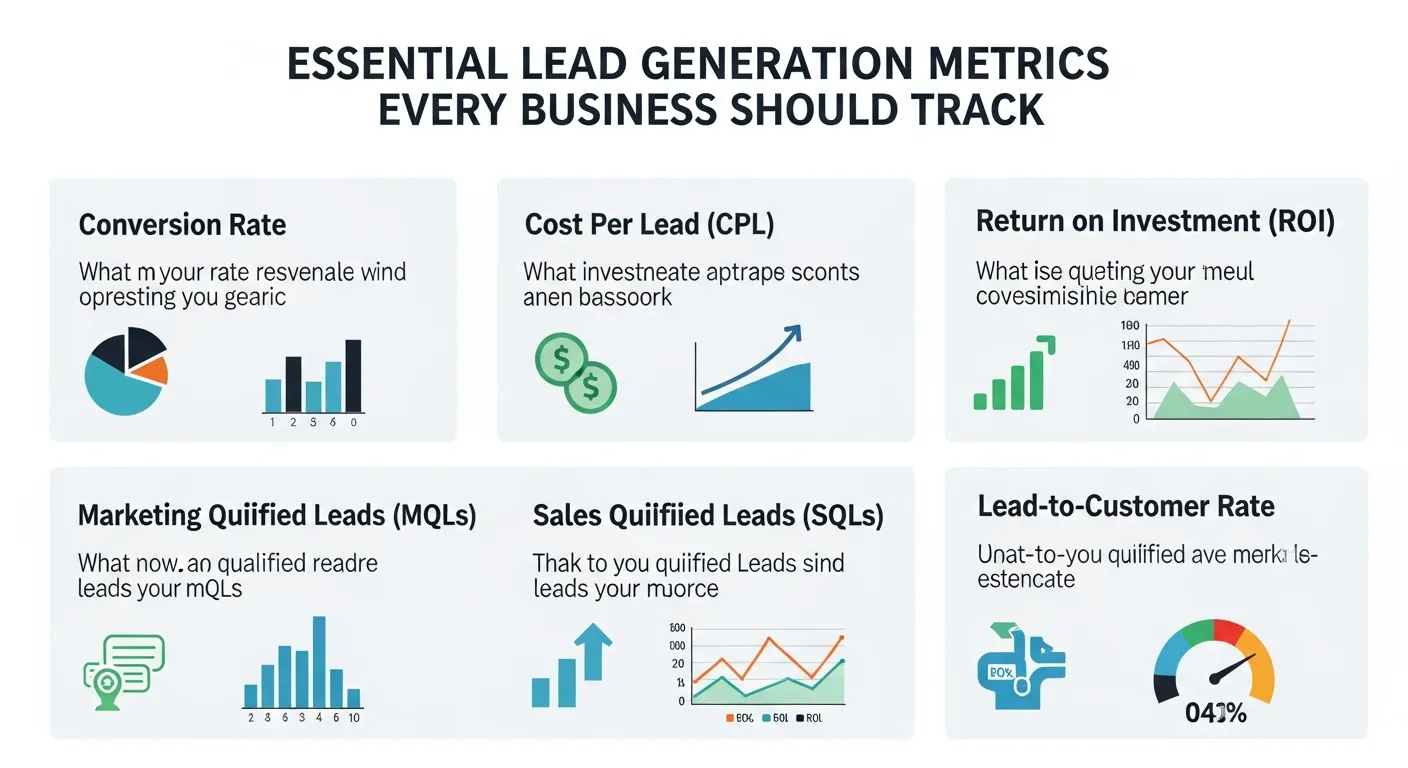
Lead generation metrics reveal how effectively prospects move from interest to revenue. Tracking volume, quality, cost, engagement, and predictive indicators helps businesses optimize performance, align sales and marketing, and forecast growth accurately. Focusing on actionable metrics—not vanity numbers—creates a scalable, data-driven system for long-term business success.
Tracking the right metrics can mean the difference between a thriving business and one that struggles to grow. While many companies focus on vanity metrics like website traffic or social media followers, the most successful organizations understand that lead generation metrics provide the clearest picture of future revenue and business health.
Lead generation isn’t just about collecting contact information—it’s about building a predictable system that consistently brings qualified prospects into your sales funnel. Without proper measurement, you’re essentially flying blind, making it impossible to optimize your efforts or justify your marketing spend.
Volume Metrics: Measuring Your Lead Generation Output

Total Leads Generated
Your total lead count serves as the foundation for all other lead generation analysis. This metric tracks the raw number of prospects who have shown interest in your product or service by providing their contact information or taking a specific action.
Track this metric across different time periods (daily, weekly, monthly, quarterly) to identify trends and seasonal patterns. A sudden drop in lead volume might indicate problems with your marketing campaigns, website functionality, or competitive pressures.
Leads by Source
Understanding where your leads originate helps you allocate marketing resources more effectively. Break down your lead generation by channel:
Digital channels include organic search, paid search, social media, email marketing, and content marketing. Traditional channels might encompass trade shows, print advertising, direct mail, and referrals.
Each source should be tracked separately to identify your most productive channels. This data becomes crucial when planning budget allocation for the following quarter or year.
Lead Velocity Rate (LVR)
Lead velocity rate measures the month-over-month growth in qualified leads. This forward-looking metric helps predict future revenue better than current sales figures because it shows the trend of your pipeline growth.
Calculate LVR using this formula: ((Number of qualified leads this month – Number of qualified leads last month) / Number of qualified leads last month) × 100
A positive LVR indicates growing pipeline health, while a declining rate signals potential future revenue problems.
Quality Metrics: Evaluating Lead Generation Effectiveness
Lead-to-Customer Conversion Rate
This metric reveals what percentage of your leads eventually become paying customers. It’s one of the most important indicators of lead quality and sales process effectiveness.
Calculate it by dividing the number of customers acquired by the total number of leads generated, then multiplying by 100 for a percentage. Industry benchmarks vary significantly, but most B2B companies see conversion rates between 2-5%.
Track this metric by lead source to identify which channels generate the highest-quality prospects. You might discover that while social media generates more leads, email marketing produces leads that convert at three times the rate.
Marketing Qualified Leads (MQLs)
Marketing qualified leads represent prospects who have demonstrated sufficient interest and fit your ideal customer profile but aren’t ready for direct sales contact. These leads typically require additional nurturing before they’re ready to speak with a salesperson.
Define clear criteria for MQL qualification based on demographic information (company size, industry, role) and behavioral signals (content downloads, email engagement, website activity). Consistent MQL criteria ensure your marketing and sales teams are aligned on lead quality expectations.
Sales Qualified Leads (SQLs)
Sales qualified leads have been vetted by your sales team and determined to have genuine purchasing intent and authority. The MQL-to-SQL conversion rate indicates how well your marketing efforts align with sales requirements.
A low MQL-to-SQL conversion rate might suggest that marketing is generating leads that don’t meet sales criteria, requiring adjustment to lead scoring models or qualification processes.
Cost and ROI Metrics: Understanding Lead Generation Economics
Cost Per Lead (CPL)
Cost per lead calculates how much you spend to generate each lead across different marketing channels. This metric helps you understand the efficiency of your lead generation efforts and compare the relative cost-effectiveness of different marketing strategies.
Calculate CPL by dividing your total marketing spend by the number of leads generated. Track this metric by channel, campaign, and time period to identify trends and opportunities for optimization.
Remember that the lowest CPL doesn’t always indicate the best channel—a higher-cost channel might generate leads that convert at much higher rates, resulting in better overall ROI.
Customer Acquisition Cost (CAC)
Customer acquisition cost measures the total expense required to acquire a new customer, including all marketing and sales costs. This metric provides crucial insight into the sustainability of your lead generation and sales processes.
Include all relevant costs in your CAC calculation: advertising spend, marketing technology, content creation, sales salaries, and any other expenses directly related to acquiring customers.
Return on Marketing Investment (ROMI)
ROMI measures the revenue generated from your marketing activities relative to the cost of those activities. This metric helps justify marketing spend and identify your most profitable lead generation channels.
Calculate ROMI using this formula: ((Revenue from marketing – Marketing costs) / Marketing costs) × 100
A positive ROMI indicates profitable marketing activities, while negative ROMI suggests you need to optimize your campaigns or reallocate budget to more effective channels.
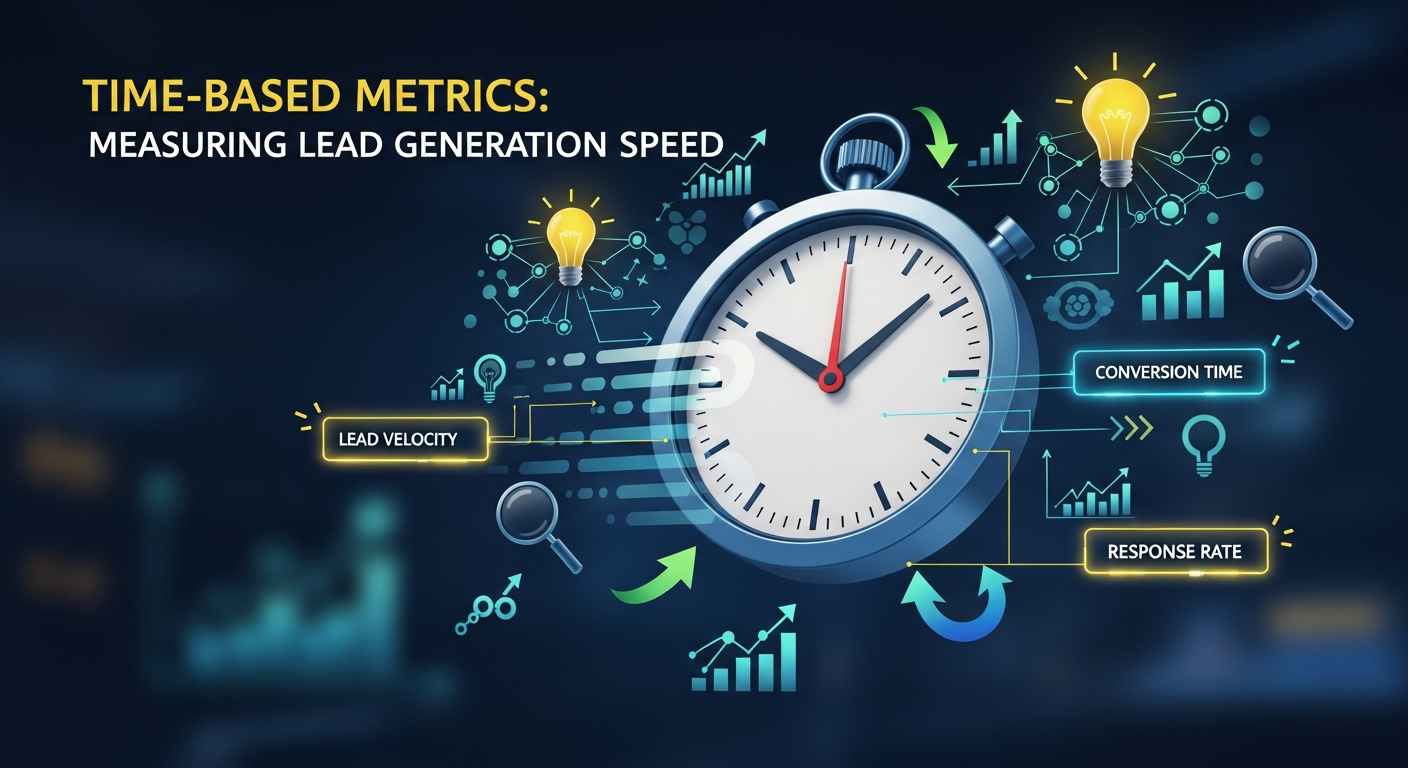
Time-Based Metrics: Measuring Lead Generation Speed
Time to Lead
Time to lead measures how quickly prospects become leads after their first interaction with your brand. Shorter time periods generally indicate more compelling offers or more urgent customer needs.
Track this metric to understand your audience’s buying timeline and optimize your lead nurturing sequences accordingly. If most prospects become leads within 24 hours, you might focus on immediate follow-up strategies. If the timeline is longer, you’ll need robust nurturing campaigns.
Lead Response Time
Lead response time tracks how quickly your team contacts new leads after they express interest. Studies consistently show that companies responding to leads within five minutes are significantly more likely to qualify and convert those leads.
Fast response times demonstrate professionalism and catch prospects while their interest is highest. Many leads will contact multiple vendors, so quick response times often determine which company gets the opportunity to present first.
Advanced Lead Generation Metrics
Lead Scoring Accuracy
If you use lead scoring to prioritize follow-up activities, track the accuracy of your scoring model by comparing predicted conversion likelihood with actual conversion rates. Highly scored leads should convert at higher rates than lower-scored prospects.
Regularly review and adjust your scoring criteria based on this analysis to improve the model’s predictive accuracy over time.
Attribution Analysis
Attribution analysis helps you understand the complete customer journey and gives credit to all touchpoints that contribute to lead generation. Many leads interact with multiple marketing channels before converting, making single-touch attribution models incomplete.
Multi-touch attribution provides a more accurate picture of which channels and campaigns contribute to lead generation success, enabling better budget allocation decisions.
Building Your Lead Generation Dashboard
Effective metric tracking requires the right tools and regular reporting processes. Choose a CRM system that integrates with your marketing tools to provide comprehensive lead tracking capabilities.
Create dashboards that display your most important metrics in real-time, allowing you to spot trends and issues quickly. Focus on metrics that directly impact business decisions rather than creating overly complex reports that obscure key insights.
Set up automated alerts for significant changes in key metrics, such as sudden drops in lead volume or conversion rates. Early detection allows for faster response and problem resolution.
Turning Metrics into Actionable Insights
Tracking metrics without taking action provides little business value. Regularly review your lead generation performance and identify specific opportunities for improvement.
If your cost per lead is increasing, investigate whether it’s due to increased competition, declining ad performance, or seasonal factors. If lead quality is declining, examine changes in your targeting criteria or lead qualification processes.
Use A/B testing to validate improvement hypotheses and measure the impact of changes to your lead generation strategies. Small optimizations compound over time to create significant performance improvements.
Regular metric analysis also helps you identify successful strategies that can be scaled or replicated across other channels or campaigns.
The metrics you track today will determine the growth you achieve tomorrow. Start with the fundamentals—lead volume, quality, and cost—then gradually add more sophisticated measurements as your lead generation program matures. Remember that the goal isn’t to track every possible metric, but to focus on the measurements that provide actionable insights for your specific business situation.
Funnel Performance Metrics: Tracking Movement Between Stages
Understanding how leads move through your funnel is critical for diagnosing growth bottlenecks. Funnel performance metrics measure progression from visitor to lead, lead to MQL, MQL to SQL, and ultimately to customer. Drop-off rates at each stage reveal where prospects lose interest or face friction. For example, high lead volume with low MQL conversion may indicate poor targeting or weak content alignment. Tracking stage-to-stage conversion rates helps marketing and sales teams collaborate more effectively and refine messaging, qualification criteria, and follow-up timing. Over time, optimizing funnel flow improves predictability, shortens sales cycles, and increases revenue efficiency without increasing lead volume.
Engagement Metrics: Measuring Prospect Intent
Engagement metrics indicate how actively leads interact with your content and brand. These include email open rates, click-through rates, website session duration, content downloads, and repeat visits. High engagement signals buying intent and readiness for deeper nurturing or sales outreach. Monitoring engagement patterns helps identify which assets resonate most and which touchpoints accelerate conversion. Engagement metrics also support lead scoring models by assigning higher value to behaviors that correlate with purchase decisions. By focusing on engagement quality rather than raw traffic, businesses can prioritize prospects most likely to convert and personalize follow-up strategies more effectively.
Lead Source Performance Metrics
Not all lead sources deliver equal value. Source performance metrics compare lead quality, conversion rates, and revenue contribution across channels such as organic search, paid ads, referrals, social media, and email marketing. This analysis reveals which channels generate high-intent prospects versus low-quality volume. A channel with fewer leads but higher close rates may outperform a high-volume source with poor conversion. Tracking source-level ROI enables smarter budget allocation, ensuring marketing spend supports sustainable growth. Over time, refining channel mix improves both efficiency and scalability of lead generation efforts.
Sales Alignment Metrics
Strong marketing and sales alignment directly impacts lead conversion success. Metrics such as MQL-to-SQL conversion rate, sales acceptance rate, and sales cycle length help measure this alignment. If sales teams consistently reject marketing leads, qualification criteria may be misaligned. Conversely, fast sales acceptance indicates strong lead quality and shared expectations. Tracking these metrics encourages collaboration, feedback loops, and continuous refinement of lead definitions. When marketing and sales operate with shared data and goals, lead handoffs improve, trust increases, and revenue outcomes become more predictable.
Retention and Lifetime Value Metrics
Lead generation doesn’t end at conversion. Metrics like customer lifetime value (CLV), repeat purchase rate, and retention rate help evaluate long-term impact of lead quality. High-quality leads tend to stay longer, spend more, and advocate for your brand. Comparing CLV across lead sources identifies which channels attract the most valuable customers—not just the fastest conversions. This perspective shifts focus from short-term acquisition to sustainable revenue growth. By optimizing lead generation for lifetime value, businesses improve profitability while reducing reliance on constant new lead acquisition.
Predictive and Forecasting Metrics
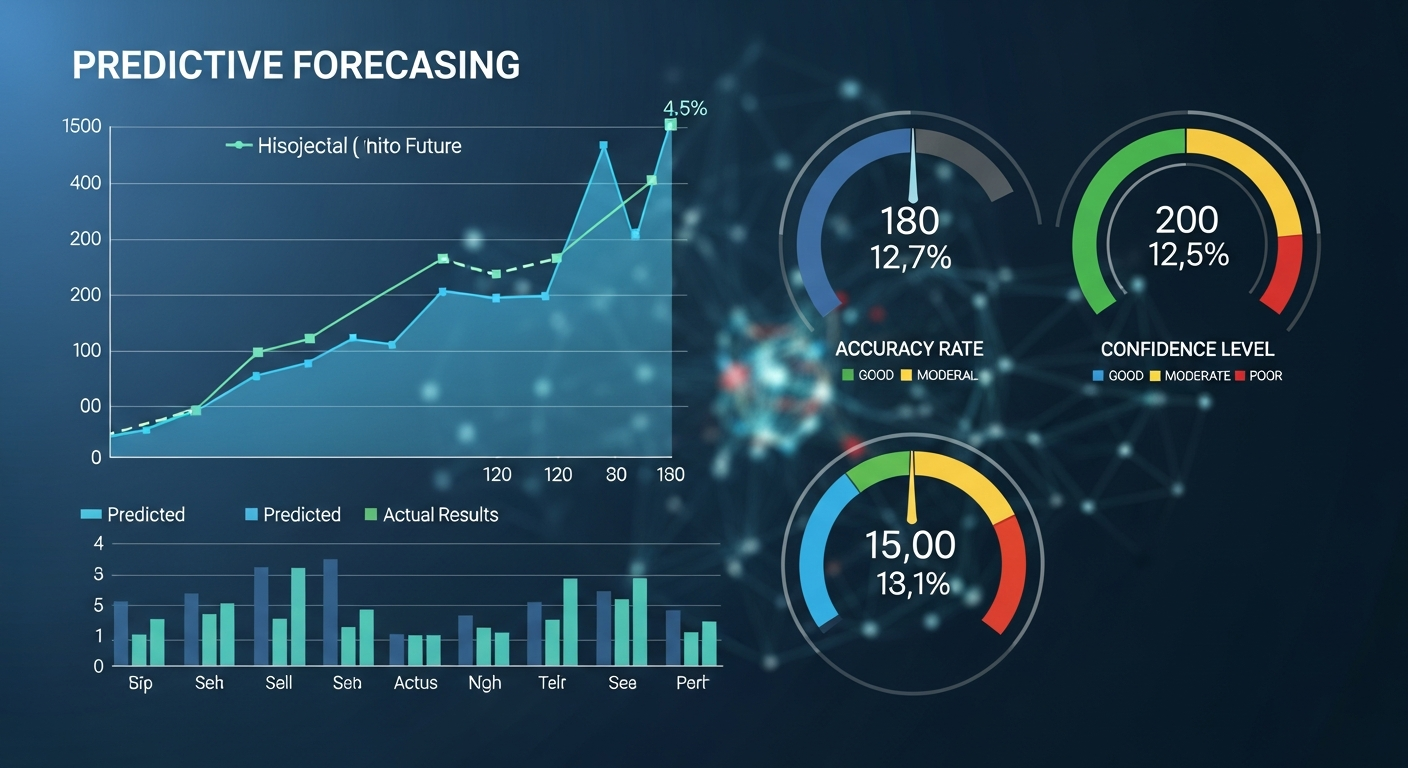
Advanced lead generation programs rely on predictive metrics to forecast future performance. Metrics like pipeline value, lead velocity rate, and historical conversion trends help estimate upcoming revenue. These insights support strategic planning, hiring decisions, and budget forecasting. Predictive metrics transform lead generation from a reactive activity into a proactive growth engine. When leadership can accurately forecast revenue based on pipeline health, businesses gain confidence, stability, and scalability. Over time, predictive analytics reduces uncertainty and improves decision-making across marketing and sales teams.
Conclusion
Lead generation metrics provide clarity, accountability, and direction for sustainable growth. By tracking volume, quality, cost, engagement, and forecasting metrics, businesses gain full visibility into their pipeline health. The real value lies not in collecting data, but in using insights to optimize strategies, align teams, and drive predictable revenue. Companies that measure intelligently grow confidently.
Frequently Asked Questions (FAQ)
1. What are lead generation metrics?
They measure how effectively prospects are attracted, qualified, and converted.
2. Which lead metric is most important?
Lead-to-customer conversion rate is one of the most critical.
3. How often should lead metrics be reviewed?
Weekly for tactical insights and monthly for strategic decisions.
4. What’s the difference between MQL and SQL?
MQLs show interest; SQLs show purchase readiness.
5. Why is lead velocity important?
It predicts future revenue growth more accurately than sales alone.
6. How do I measure lead quality?
By conversion rates, engagement levels, and customer lifetime value.
7. Are vanity metrics useful?
Only when paired with conversion and revenue metrics.
8. What tools track lead generation metrics?
CRMs, marketing automation platforms, and analytics tools.
9. How can I lower cost per lead?
Improve targeting, messaging, and conversion optimization.
10. Can lead metrics improve sales performance?
Yes, by improving prioritization and follow-up timing.
11. Should small businesses track advanced metrics?
Start simple, then scale as processes mature.



Leave a Reply